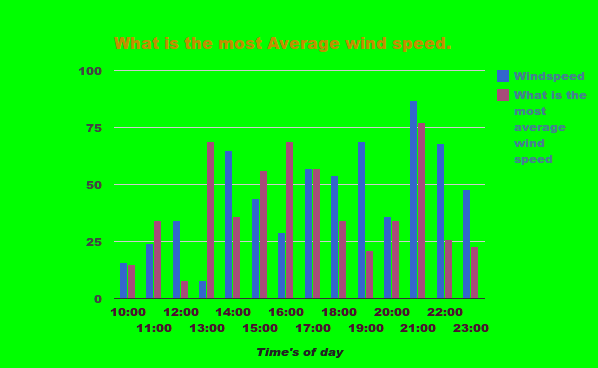
And the next one is an chart It shows that how big is the wind speed is as you can see there are bar graphs it goes big and then small and big and small. that is super cool.

The next one is A bar graph but it side ways I shows you how good the weather is and how bad it is as you can see the blue bars are the good weather and the red bars is the bad weather.
I conclude that The wind will die down at 21:00 or at 9:00 pm and i conclude that the wind will pick up at 20:00 or at 8:00 pm.


Those are really informative graphs son. I love how you've made them into 3 different graph types and explained what they stand for. You're Super. Nicely done sweetheart, I love you =) P.S: Proof read your writing Sonshine...Xx
ReplyDelete